Our Activity Dashboard gives an overview of your activity as well as company, group or team activity.
Select what level of activity you want to look at:
See activity for your company, group or team or simply see your own activity. Filter by date and / or if you are in the group or team section, select the specific team / group you want to view.
Summary table
Overview: The summary table gives you an overview of how active your used have been. It can be filtered to show over a specific time period. You can also toggle to show by completion, started, clicked or viewed and can toggle to show activity for Learnlists.
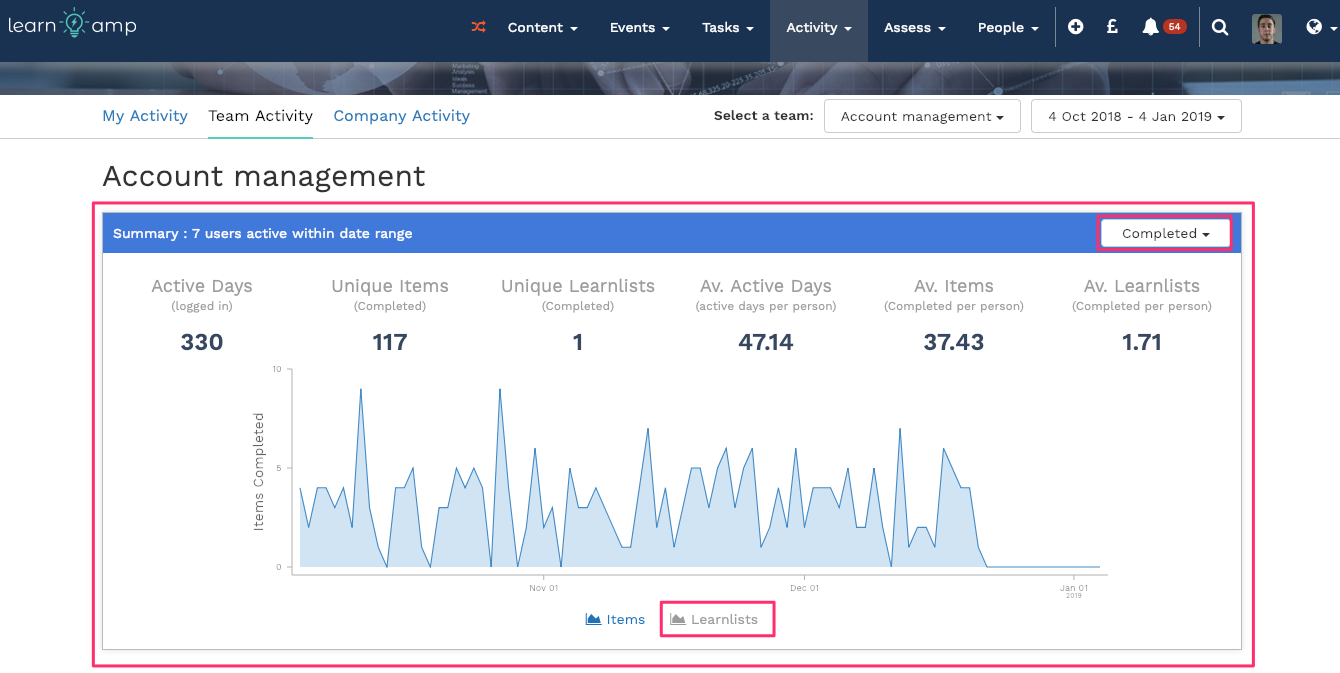
Active days: Other systems track log-ins alone. We felt that this was a 'vanity metric' - basically meaningless. Instead we decided to track the number of active days that a user logs in and does some form of activity, whether this is to view an item, complete something, add something etc.
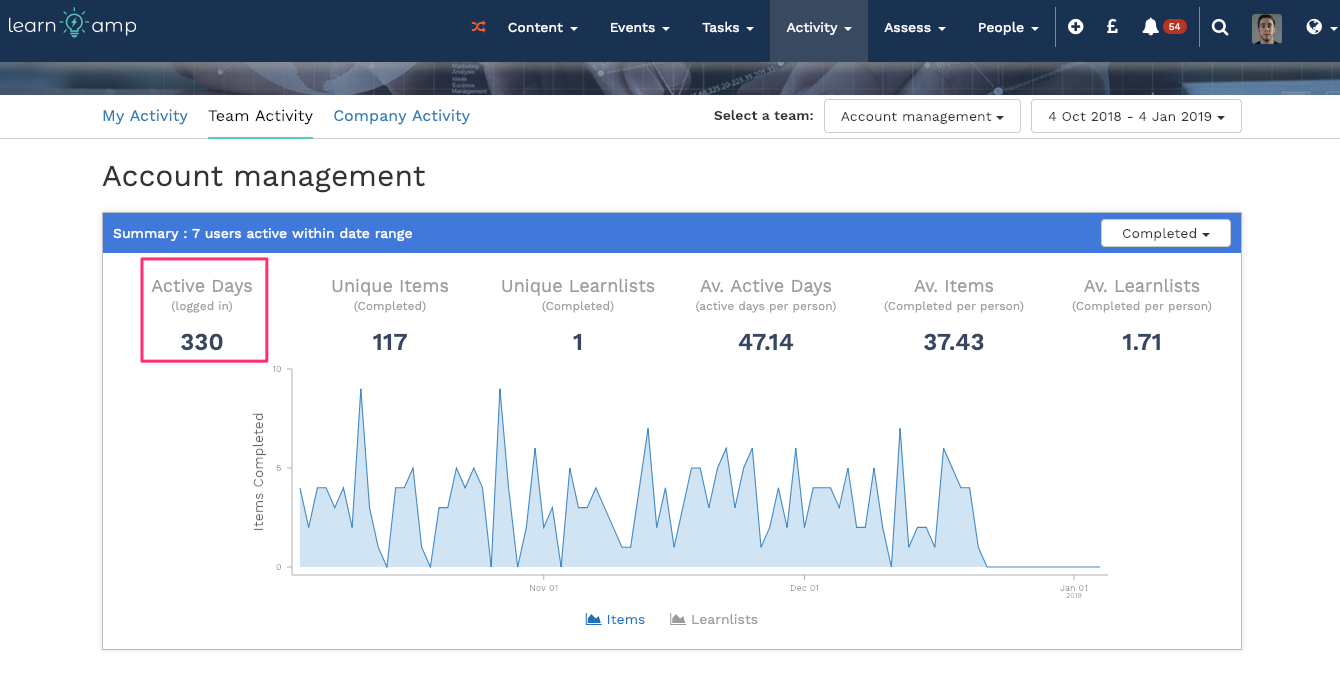
Unique items: This shows the number of different items that have been completed. This gives an idea of the variety of content being accessed.
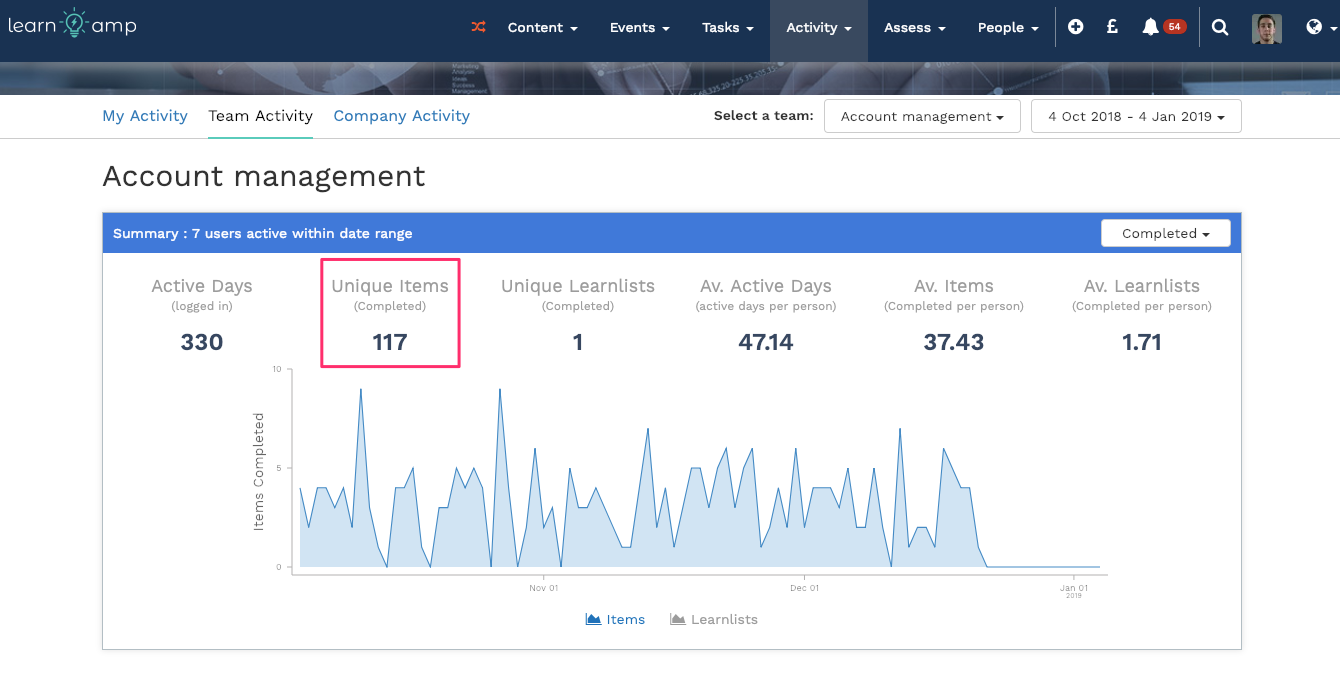
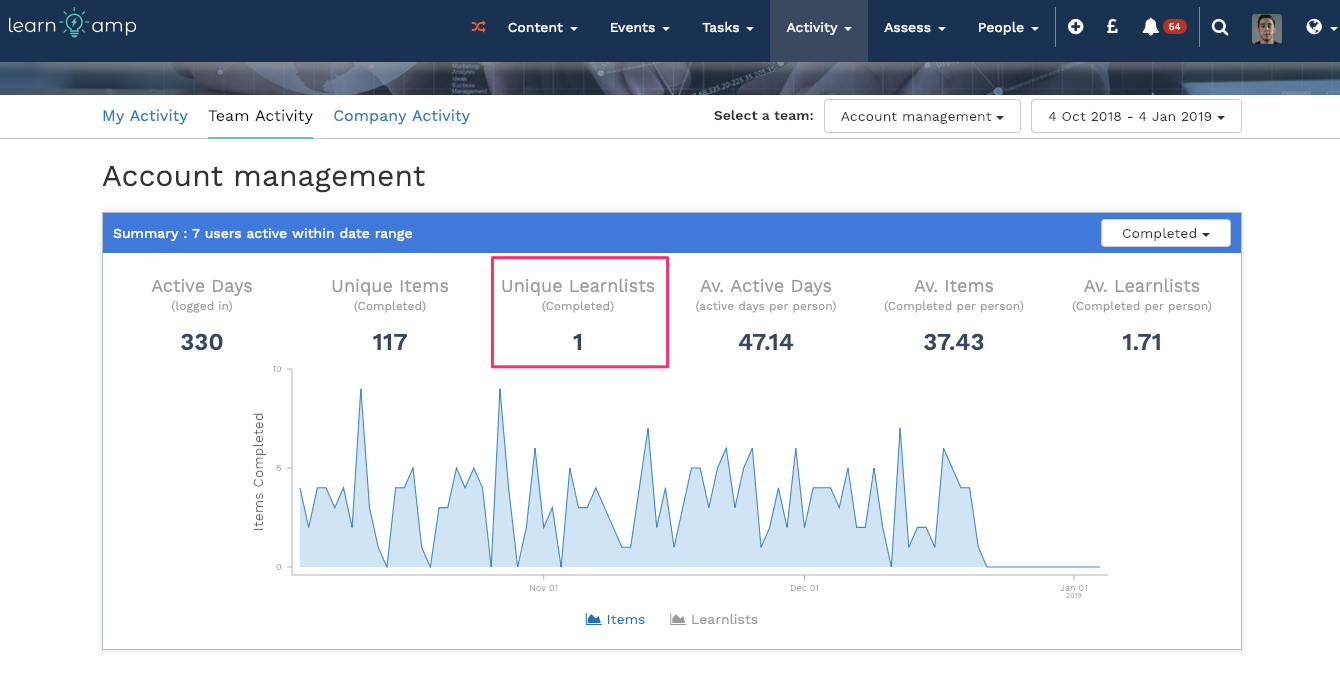
Unique Learnlists: Following the same logic, unique learnlists are the number of different full Learnlists that have been completed during the period
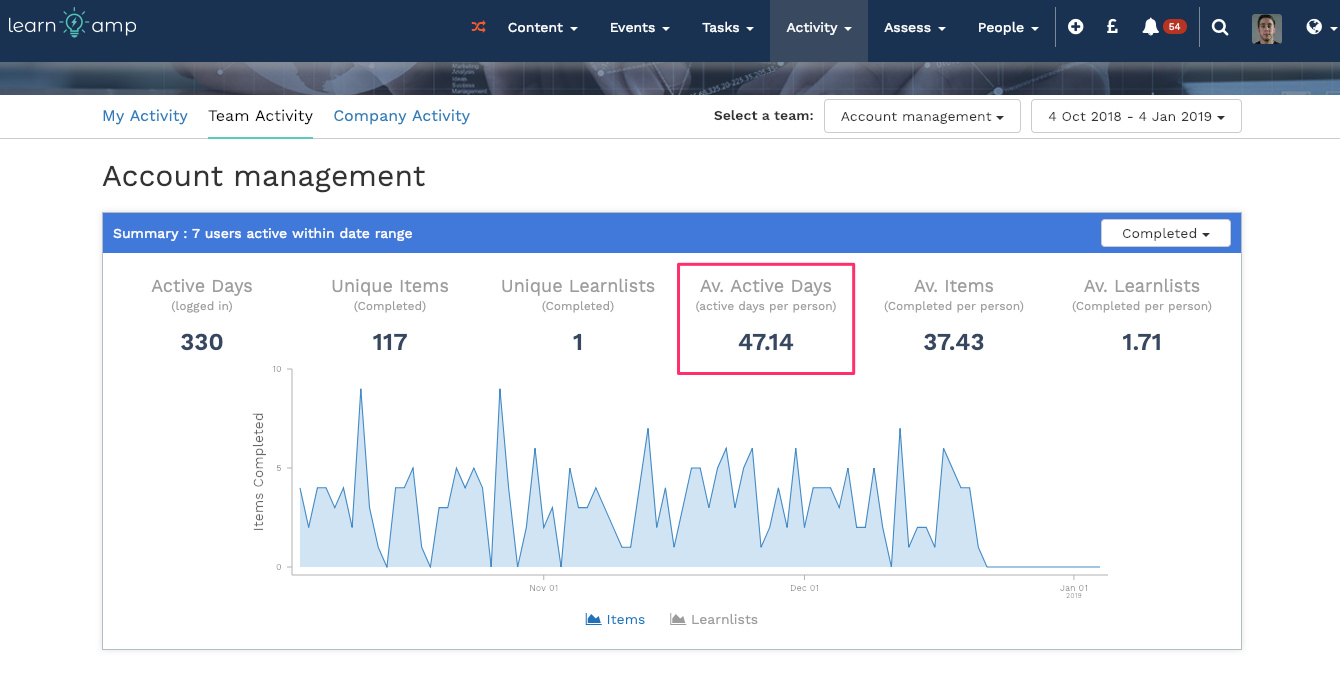
Av. Active Days: This shows that of those who were active during the period, what the average number of active days were. This shows the difference between those who were engaged and those who haven't engaged at all.
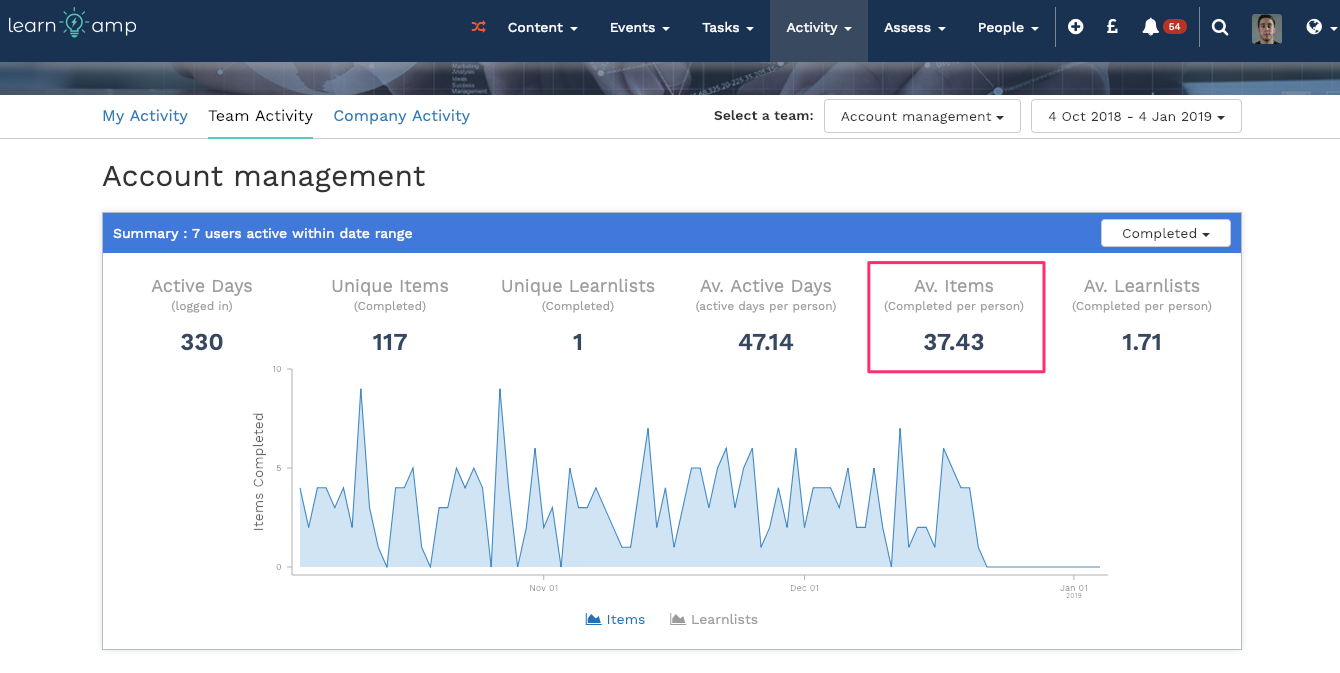
Av. items: This shows the average number of items completed per person across the business giving an indication of engagement.
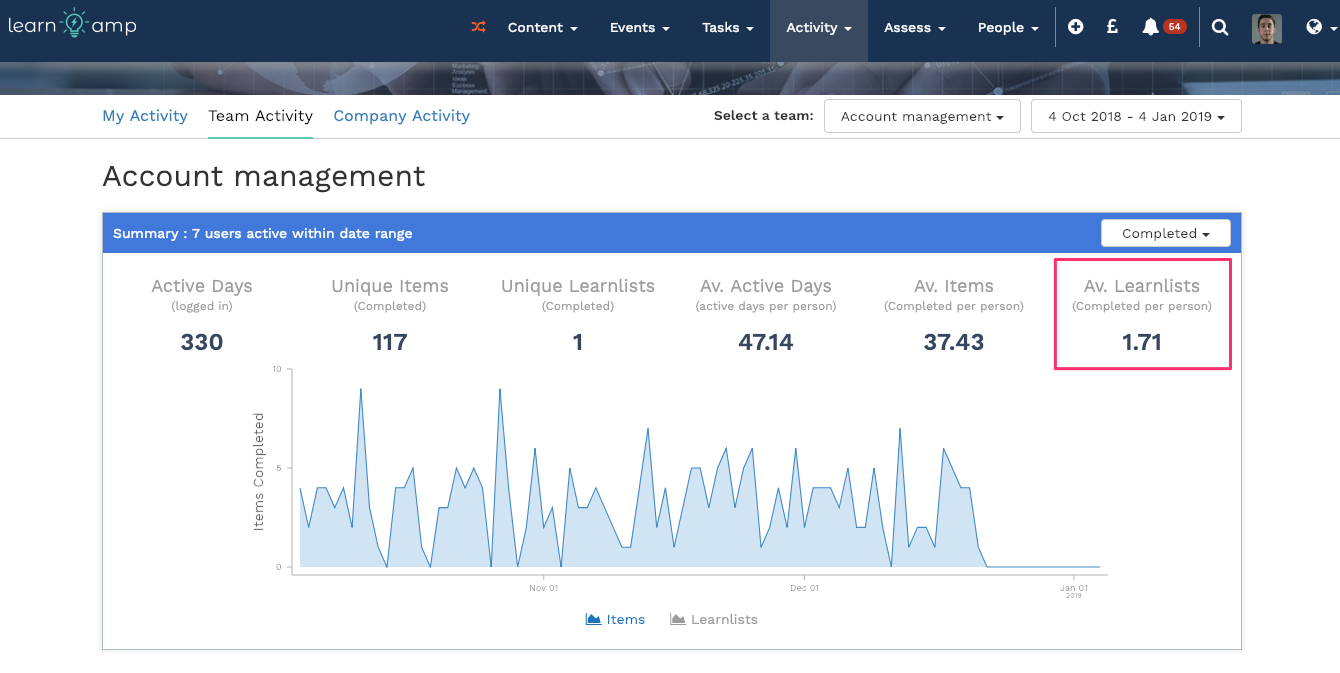
Av. Learnlists: Again this shows the av. number of Learnlists completed per person over this time period. This will naturally be a lower number but also helps to show engagement.
Tables and leaderboards:
Leaderboard: This is leaderboard of content consumed for example the 'most items completed'. This can be filtered to show Items (completed, started, clicked, viewed) and Learnlists (completed, started, viewed)
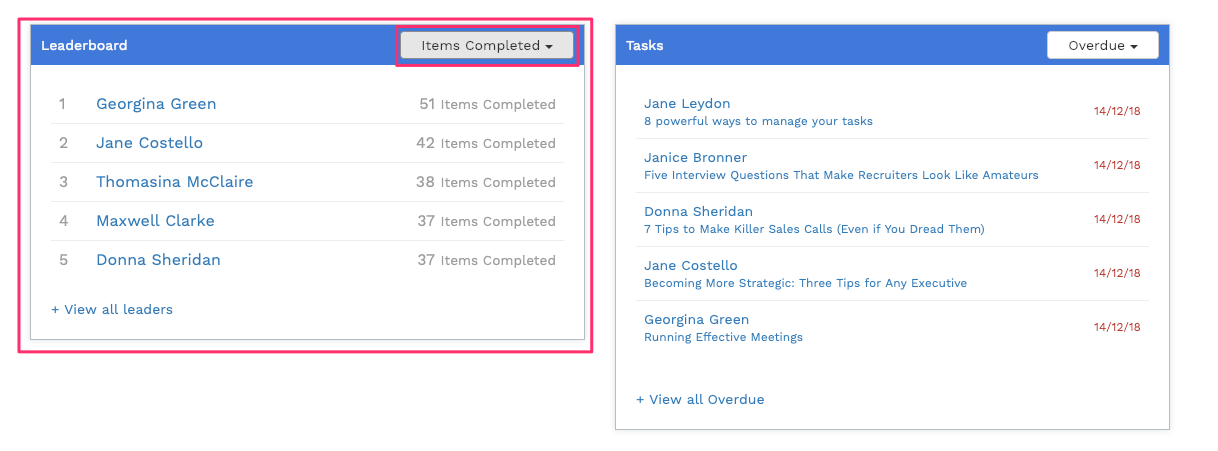
Tasks: See the tasks for this set of people and can be filtered by Overdue, Upcoming or Newest

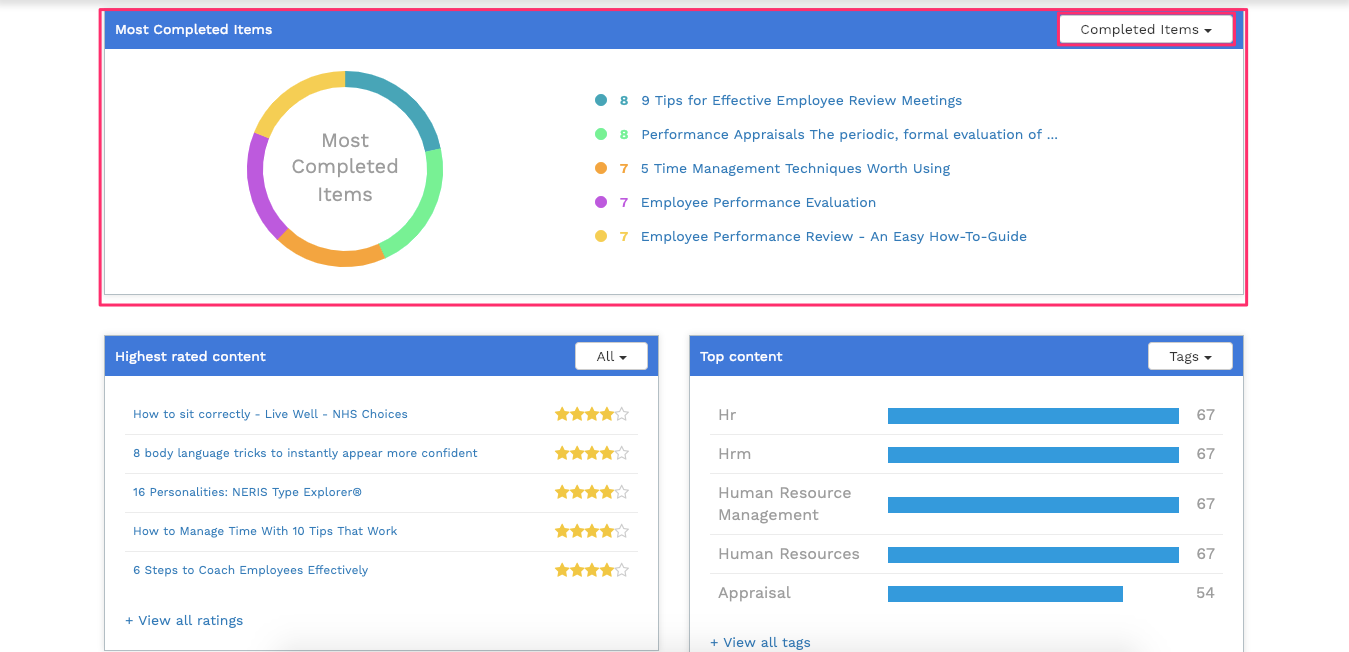
Most completed items: A list of the most completed items by this set of people, useful to work out whether people are completing the right things. This can be filtered to show most completed items or learnlists (or started, clicked and viewed).
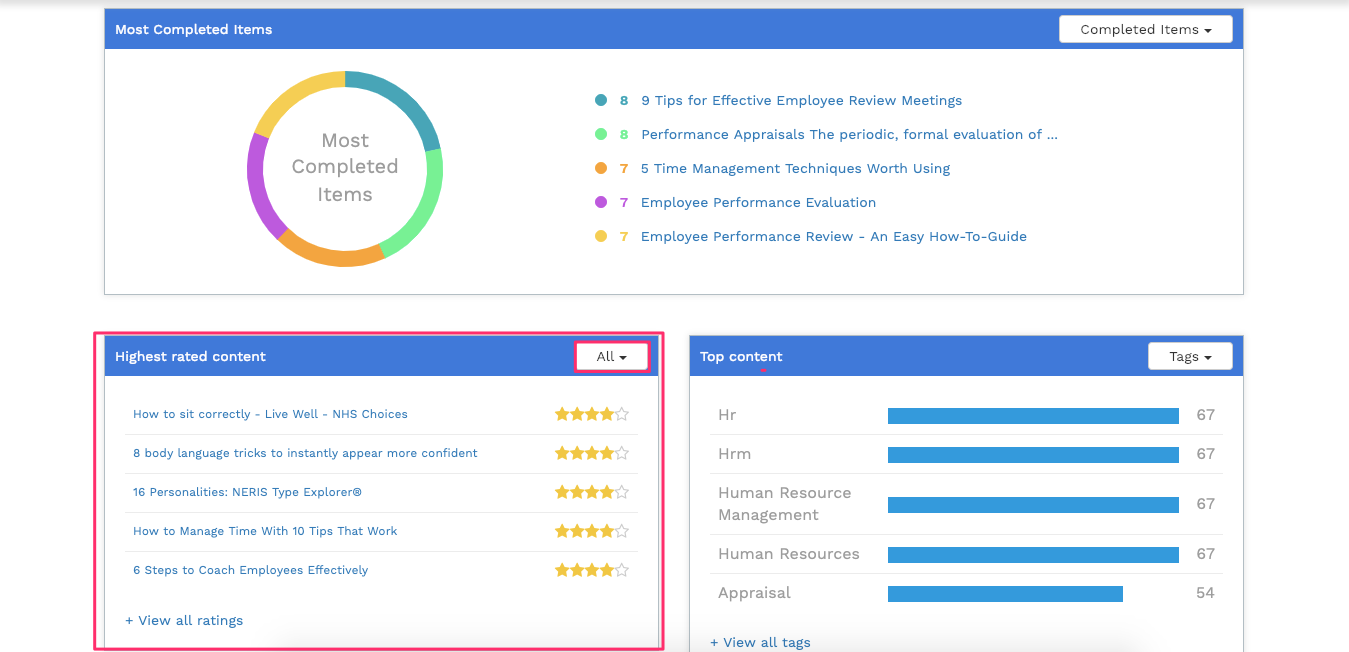
Highest rated content: To get an idea of the most popular content within your account you can see the highest rated content. This can be filtered to just show ratings from people within your company.
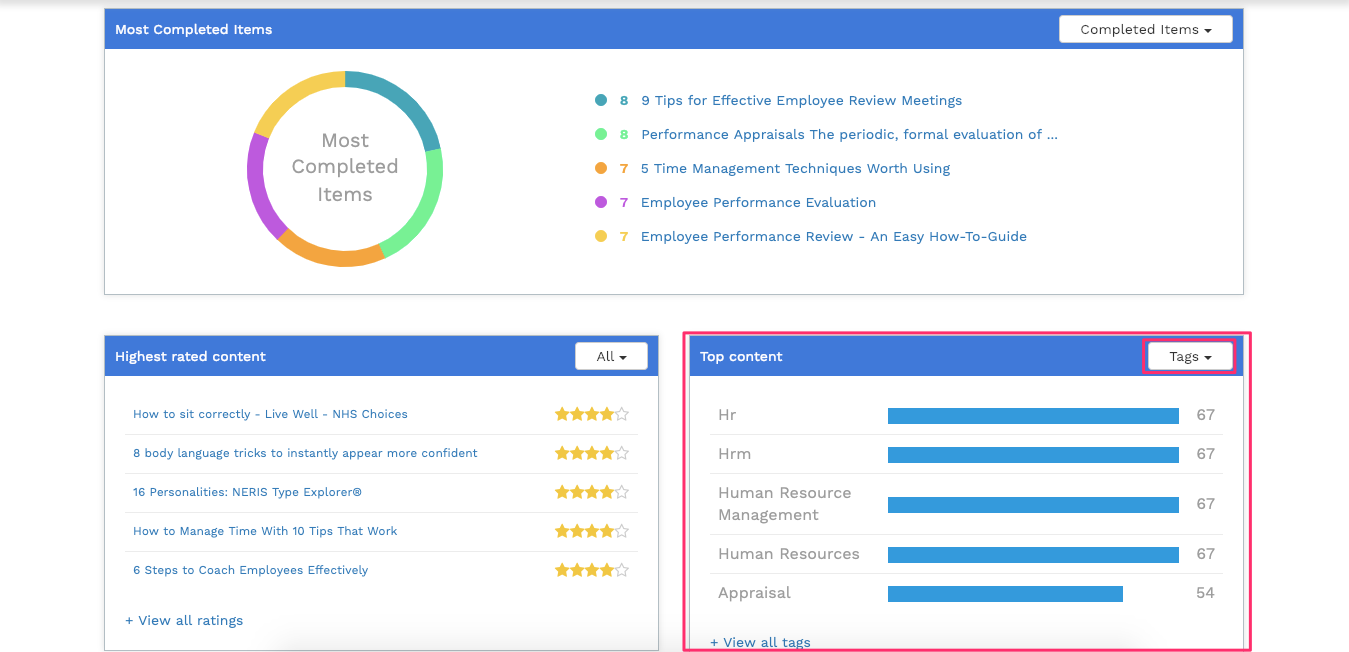
Top content by...: This shows you the top content by a particular filter, by default set to 'Tags' but can also be filtered by Content Type and Supplier. This gives you a steer on what other types of content you might want to produce.
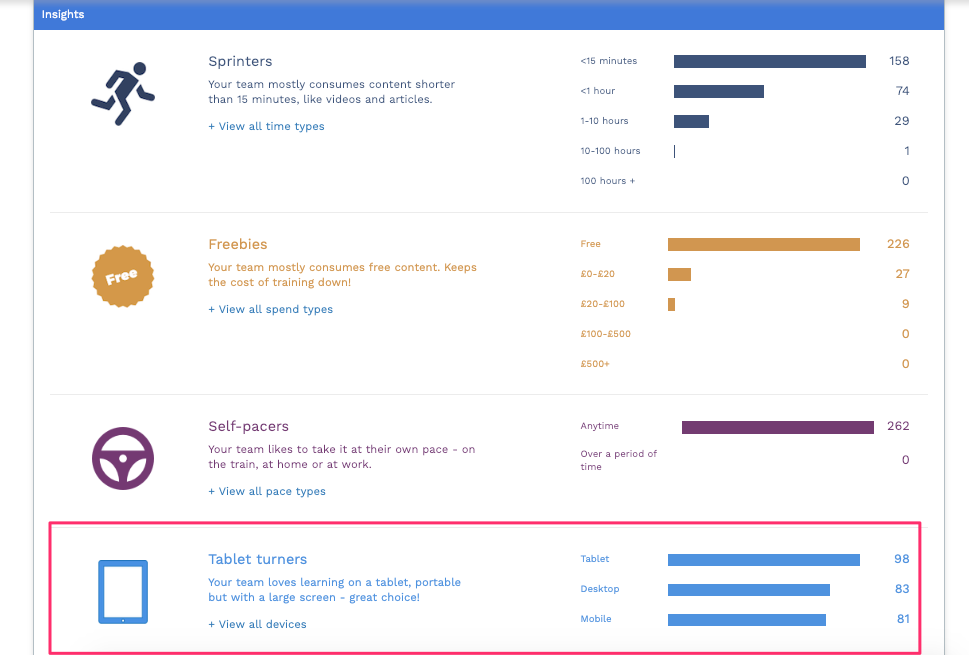
Insights:
Get insights into the types of content this set of people like.
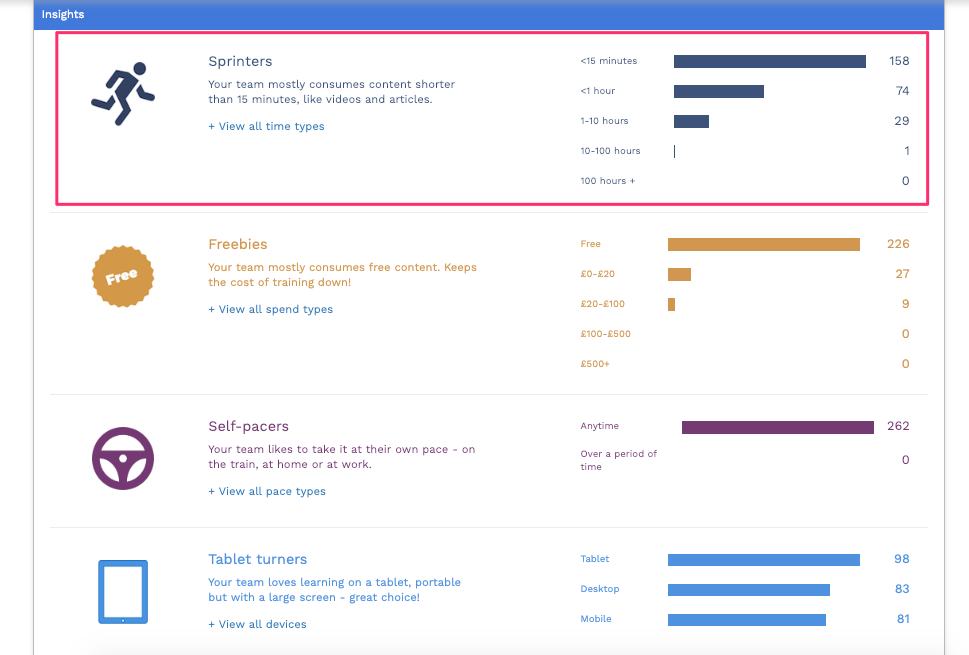
Content duration: See whether this set of people like short form content, or longer and what the breakdown is
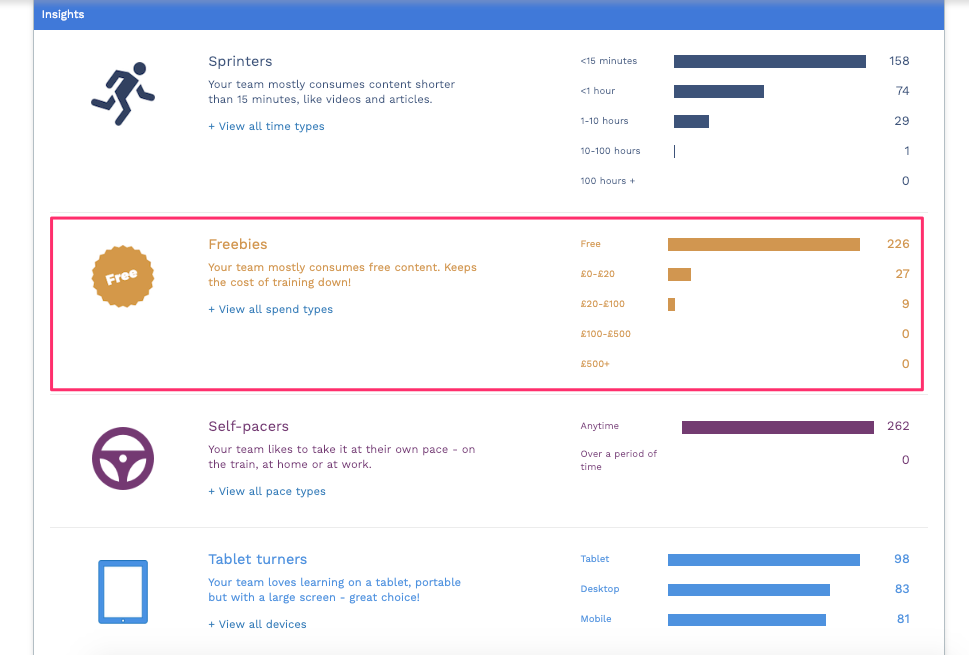
Price: Understand whether your learners are gravitating towards paid content, which may suggest you need to give them a budget, or whether they prefer free content.
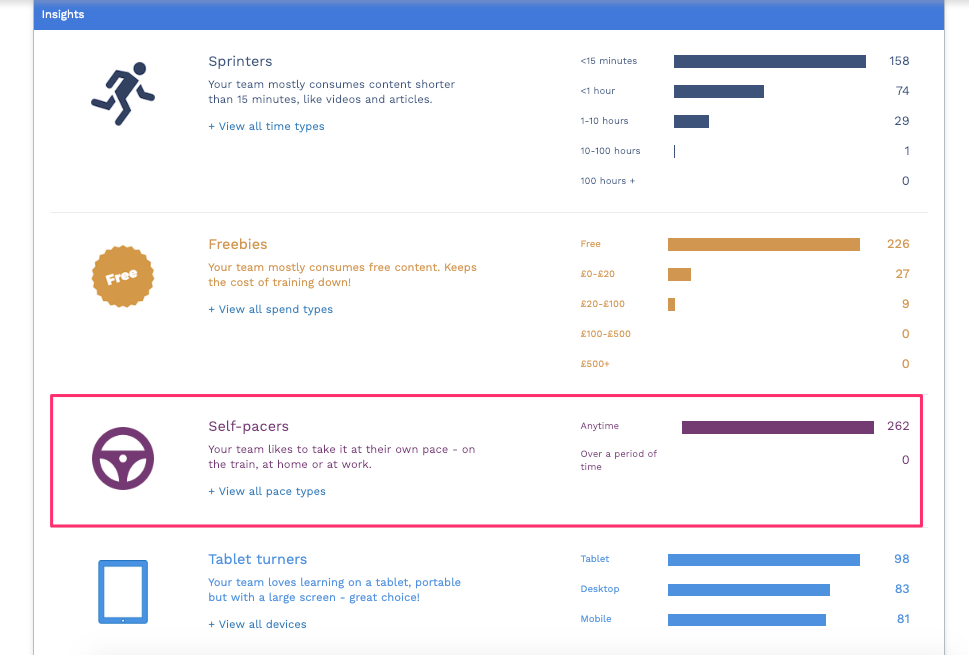
Pace: Some content can be consumed immediately/any time whilst others are constrained for example courses over a number of weeks. This shows you which this set of people prefer
Device type: Learn Amp is suitable for any device and therefore you may find your learners using it on a number of devices. This insight gives you the breakdown of how often the account is accessed on each device.
