...
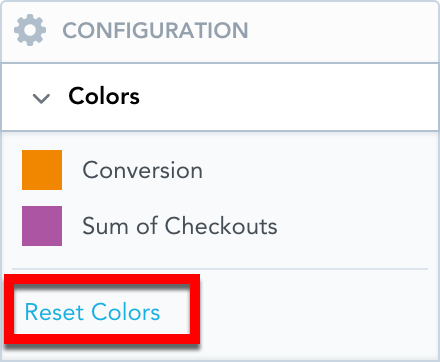
To revert to the original colors, go to Configuration → Colors and click Reset colors.
Data Sampling
Use data sampling to quickly determine the viability of a particular visualization by processing only a percentage of the total available rows in the associated datasets instead of processing all of the data. Data sampling can be enabled at any point during the analysis, but enabling the option before you build the visualization will provide the most benefit as visualizations are built dynamically according to input.
Data sampling creates a smaller set of data from a much larger set of data. Because the rows are chosen randomly, the results are unstable and therefore unsuitable for persistent objects like visualizations and dashboards.
Visualizations cannot be saved with the results from data sampling. The option must be re-enabled whenever you leave the analytical designer.
Notes
Data sampling is available only for workspaces that use Vertica Data Sources.
Data sampling is available for use only within Analytical Designer and through the API.
If the database associated with the logical data model contains a view, data sampling is unavailable.
Steps:
Enable the data sampling option.
Set the sample size percentage. The size must be a number greater than 0.0 and lower than 100.0. The selected percentage of rows will be used when computing the visualization.
Note
Because only a percentage of the total rows are used in the computation and the decision of which rows to use is random, setting a low sample size with a small set of data can result in 0 rows being used during computation. Adjust the values until you receive usable results.
Select apply.
Build your visualization.
...
Example of a Column Chart
...
